How to Optimize SQL Server Performance Without Hardware Upgrades
That spinning wheel. The dreaded timeout error. Users complaining that the application is “slow.” Your first instinct might be to throw money at the problem: “We need more RAM! A faster CPU! SSDs!”
Stop. Before you submit that purchase order, know this: most SQL Server performance problems are not hardware problems. They are configuration, design, and query problems.
Throwing hardware at a poorly tuned database is like putting a Formula 1 engine in a car with flat tires and a dirty air filter. You’re spending a fortune but not fixing the real issues.
The good news? The most powerful performance gains are often free. They come from smart tuning. Let’s roll up our sleeves and uncover the hidden performance lurking in your current setup.
Step 0: Measure First, Optimize Second
You can’t optimize what you don’t measure. Never guess. Always use data to guide your efforts. Start here:
- Establish a Baseline: Use Performance Monitor (PerfMon) to track key metrics before you make changes. This tells you if your changes are helping.
- Identify Your Top Wait Stats: Wait stats tell you what SQL Server is waiting on. Run this query to see the biggest bottlenecks:sqlSELECT wait_type, wait_time_ms, signal_wait_time_ms FROM sys.dm_os_wait_stats WHERE wait_time_ms > 0 ORDER BY wait_time_ms DESC;Common culprits:
PAGEIOLATCH_*(waiting for disk I/O),CXPACKET(parallelism),LCK_*(blocking).
10 Expert Tuning Tips to Implement Today
1. Find and Fix Your Slowest Queries
This is the #1 highest-impact action. Use SQL Server’s built-in Query Store or Dynamic Management Views (DMVs) to find the queries consuming the most CPU, logical reads, or time.
text
```sql
-- Find top 10 queries by total worker time (CPU)
SELECT TOP 10
    qs.total_worker_time,
    qs.execution_count,
    qs.total_worker_time / qs.execution_count AS [Avg CPU Time],
    SUBSTRING(st.text, (qs.statement_start_offset/2)+1,
        ((CASE qs.statement_end_offset
            WHEN -1 THEN DATALENGTH(st.text)
            ELSE qs.statement_end_offset
        END - qs.statement_start_offset)/2) + 1) AS statement_text
FROM sys.dm_exec_query_stats AS qs
CROSS APPLY sys.dm_exec_sql_text(qs.sql_handle) AS st
ORDER BY qs.total_worker_time DESC;
```
2. Index Smartly: Eliminate Scans, Seek Reads
- Missing Indexes: Look for
INDEX_SCANin execution plans. Use the Missing Index DMVs as a starting point (but validate them!).sqlSELECT * FROM sys.dm_db_missing_index_details; - Unused Indexes: Indexes slow down writes (
INSERT,UPDATE,DELETE). Remove any that aren’t being used.sqlSELECT * FROM sys.dm_db_index_usage_stats WHERE user_seeks = 0 AND user_scans = 0 AND user_lookups = 0; - Fragmentation: Rebuild or reorganize heavily fragmented indexes (>30% fragmentation).sqlSELECT name, avg_fragmentation_in_percent FROM sys.dm_db_index_physical_stats(DB_ID(), NULL, NULL, NULL, NULL) AS a JOIN sys.indexes AS b ON a.object_id = b.object_id AND a.index_id = b.index_id;
3. Tune Your Query Writing
- Avoid
SELECT *: Only return the columns you need. This reduces I/O and memory pressure. - Beware of Non-SARGable Queries: Queries that can’t use indexes effectively. Avoid functions on columns in the
WHEREclause (e.g.,WHERE YEAR(CreateDate) = 2023). Rewrite to be SARGable (e.g.,WHERE CreateDate >= '2023-01-01'). - Use EXISTS() instead of COUNT(): To check for existence,
EXISTSis faster thanCOUNT(*) > 0because it can stop processing after the first match.
4. Configure Memory Settings Correctly
SQL Server is a memory hog by design, but it needs to be configured correctly.
- Max Server Memory: This is critical. Never let SQL Server use 100% of the OS memory. Leave enough for the OS and other processes. A good starting point is to leave 4-8 GB for the OS. Configure it in Server Properties -> Memory.
- Min Server Memory: Set this to prevent SQL Server from shrinking too much under pressure.
5. Manage Blocking and Deadlocks
- Keep Transactions Short & Sweet: Hold locks for the minimal amount of time necessary. Do any pre-work before starting the transaction.
- Check Isolation Levels: The default
READ COMMITTEDis usually fine, but sometimesREAD COMMITTED SNAPSHOTcan reduce blocking by using row versioning instead of locks. - Use Appropriate Indexes: Often, blocking occurs because a query is scanning a large table, holding locks for too long. A better index can make the query faster and release locks quicker.
6. Review and Tune Parallelism
The CXPACKET wait type is a common sign of parallelism issues.
- Cost Threshold for Parallelism: The default value is 5 (from SQL 2016 onward), which is often too low. Increase this to a higher value (e.g., 30-50) so only more expensive queries go parallel. This reduces coordination overhead.
- Max Degree of Parallelism (MAXDOP): The default (0) allows SQL to use all CPUs for a single query. This can be overkill. A common best practice is to set
MAXDOPto half the number of cores per NUMA node, or to 8 for very large systems. Test to find the right value for your workload.
7. Update Statistics
Out-of-date statistics cause the query optimizer to make bad plans (e.g., choosing a table scan instead of a seek). Ensure AUTO_UPDATE_STATISTICS is on. For large tables or after significant data changes, consider manually updating stats:sql UPDATE STATISTICS YourTableName;
8. Leverage Caching
- Plan Cache: Parameterize your queries to encourage plan reuse. Avoid ad-hoc queries with hard-coded values in the application layer.
- Buffer Cache: The more of your active data that fits in memory (the buffer pool), the less physical I/O you need. This is why proper memory configuration and efficient queries (that read less data) are so important.
9. Check for I/O Bottlenecks
If your PerfMon or wait stats show high PAGEIOLATCH_* waits, your disks are struggling.
- Use PerfMon Counters: Monitor
Avg. Disk sec/ReadandAvg. Disk sec/Write. Ideally, these should be below 5-10ms. Higher values indicate a disk subsystem problem. - Even with existing hardware, you can help by optimizing queries to do less I/O (using indexes) and ensuring your database files (mdf, ldf, ndf) are on different physical drives.
10. Consider Database Design (The Long Game)
Sometimes the issue is architectural.
- Normalization/Denormalization: Is the database over-normalized, requiring excessive joins? Sometimes a little denormalization for reporting can be a huge performance win.
- Partitioning: For very large tables, partitioning can make index maintenance and querying much faster by allowing SQL to eliminate entire chunks of data from the scan.
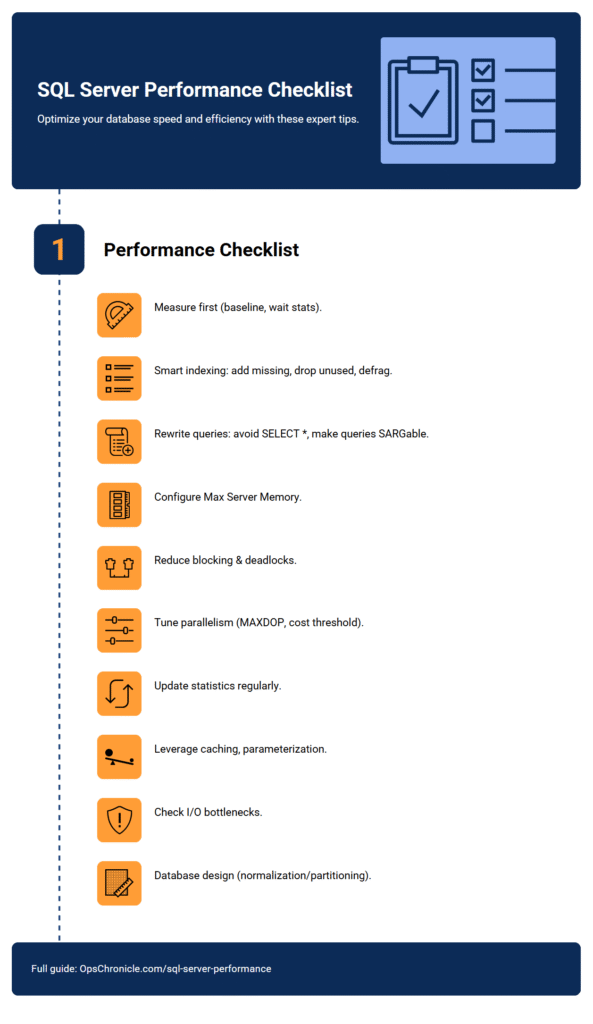
The Bottom Line: Your Tuning Checklist
- 🔍 Measure: Find your top waits and most expensive queries.
- 📑 Index: Add missing indexes, remove unused ones, defragment.
- ✍️ Rewrite: Fix non-SARGable predicates and inefficient query patterns.
- ⚙️ Configure: Set
Max Server Memoryand reviewMAXDOP/Cost Threshold. - 🔄 Maintain: Ensure statistics are up-to-date and corruption checks are run.
By methodically working through this list, you will almost certainly uncover significant performance gains without ever opening a server cabinet. You’ll not only make your database faster—you’ll become a more insightful and valuable developer or DBA.
Prefer visuals? You’ll find a full infographic summary of these 10 SQL Server performance tuning tips at the end of this article.
FAQ Section
Q: What is the single most important thing to check for SQL Server performance?
A: The top wait stats. This immediately tells you the primary bottleneck—whether it’s I/O (PAGEIOLATCH_*), CPU (SOS_SCHEDULER_YIELD), memory pressure (PAGELATCH_*), or blocking (LCK_*). It’s the fastest way to know where to focus your efforts.
Q: How often should I rebuild SQL Server indexes?
A: There’s no one-size-fits-all answer. It depends on how volatile your data is. Don’t do it on a arbitrary schedule. Instead, use the sys.dm_db_index_physical_stats DMV to check fragmentation weekly. Only rebuild indexes with fragmentation over 30% and reorganize those between 5% and 30%. Indexes with less than 5% fragmentation don’t need attention.
Q: Will increasing ‘Max Server Memory’ always improve performance?
A: No, and this is a common misconception. If you set it too high, you can starve the OS and other processes, leading to paging, which is disastrous for performance. If you set it too low, you force SQL Server to flush its cache to disk more often. You must find the correct balance for your specific server’s total RAM and workload.
Q: What’s the difference between a reorganize and a rebuild?
A: An ALTER INDEX ... REORGANIZE is an online operation that defragments the leaf level of an index by physically reordering pages. It uses less resources and is non-blocking. An ALTER INDEX ... REBUILD is a more intensive operation that effectively creates a new copy of the index and drops the old one. It is faster and more effective for high fragmentation but requires more system resources and can be blocking unless done with the ONLINE = ON option.
Q: Why is parameterization important for performance?
A: When you use parameters (e.g., in stored procedures or parameterized queries), SQL Server can reuse the same execution plan for different parameter values. If you use literal values (e.g., SELECT * FROM Users WHERE Name = 'John'), each unique value generates a new plan, bloating the plan cache and wasting CPU on compilation. This is known as “plan cache pollution.”
No post found!
How to Optimize SQL Server Performance Without Hardware Upgrades